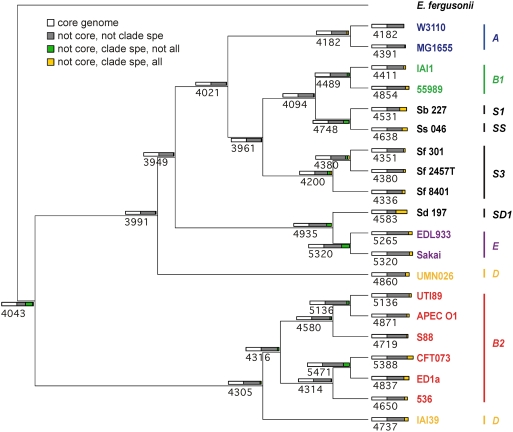
Figure 6. Inferred gene content evolution in the lineage of Escherichia coli.
The cladogram shows the phylogenetic relationships among the 20 E. coli/Shigella genomes rooted on the E. fergusonii genome, as in Figure 4, but ignoring branch lengths. The major phylogenetic groups are indicated by the vertical lines. Each strain and internal node of the tree is labelled with the number of genes present (as inferred by maximum likelihood: see Materials and Methods). Coloured rectangles represent different gene classes within the gene repertoires of ancestral and modern E. coli. Rectangle widths are proportional to the number of genes. The four different gene classes (by colour) include genes that are: in the core genome (white), not clade-specific (grey), clade-specific but not ubiquitous in the clade (green) and both clade-specific and ubiquitous in the clade (yellow). A clade-specific gene is one that is inferred to be present only in the node and its descendent nodes.

