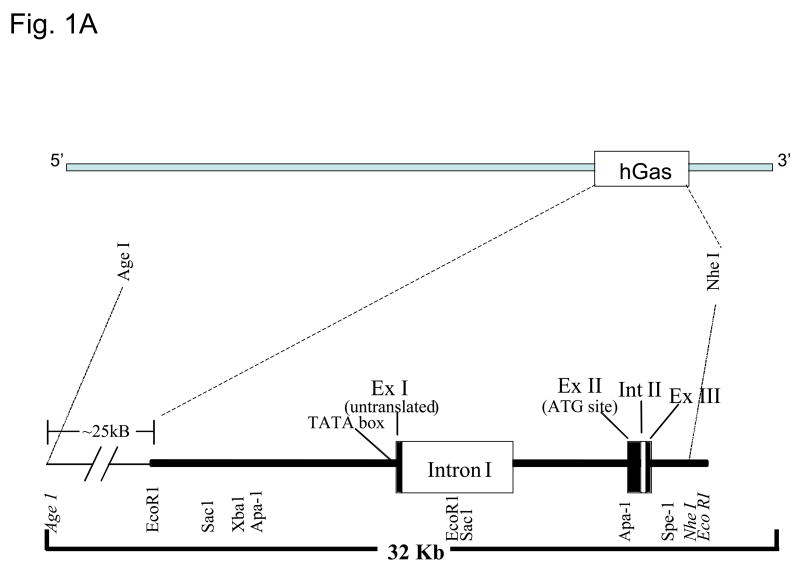
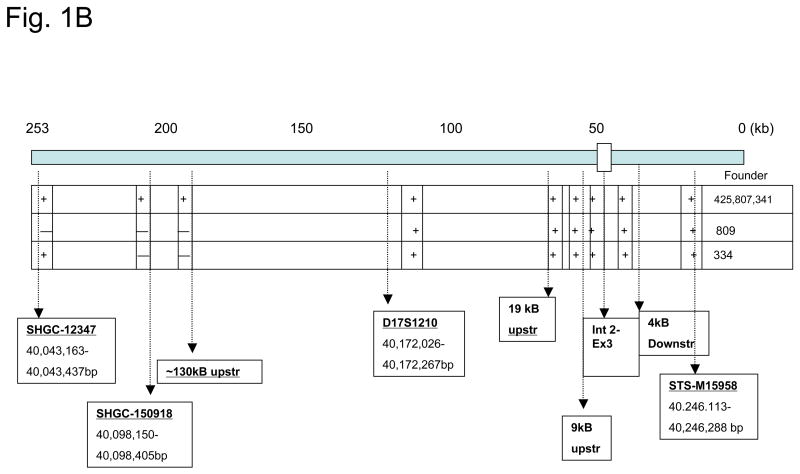
Figure 1. Characterization of hGasBAC.
Panel A. The genomic segment encompassing the human gastrin gene locus is represented as a horizontal line. Exons are represented as filled boxes and introns are unshaded. The various restriction sites spanning the 5′ and 3′ regions and the size of the genomic human gastrin gene hGas is indicated.
Panel B. Long-range map showing the various sequence-tagged-site (STS) and restriction sites for clone characterization of the genomic segment.


