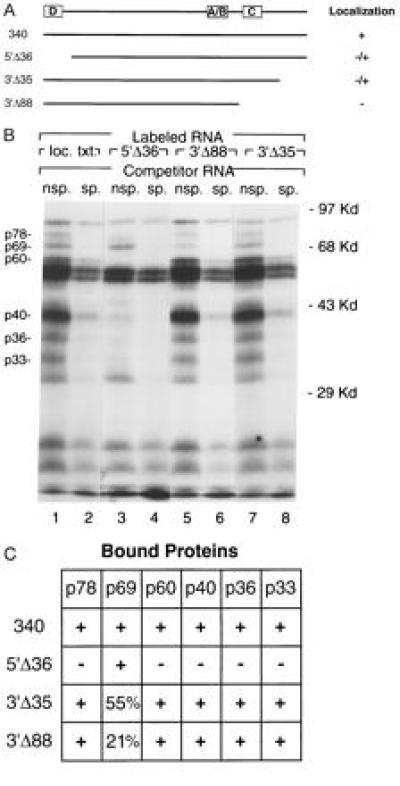
Figure 4.

Analysis of deletion mutants. (A) A schematic of the minimal localization element is shown at the top, with the positions of the RNA fragments from complexes A–D (see Fig. 3) indicated by boxes. The deletion transcripts that abolish or impair localization are represented schematically by lines, drawn to scale below the minimal localization transcript. The activity of each transcript in localization assays (12) is indicated to the right: (+) normal vegetal localization, (−/+) impaired localization, and (−) no detectable localization. (B) The binding profiles for deletion transcripts 5′Δ36 (lanes 3 and 4), 3′Δ88 (lanes 5 and 6), and 3′Δ35 (lanes 7 and 8) are compared with that of the entire localization transcript (lanes 1 and 2). In vitro binding reactions contained 32P-labeled RNA transcripts, stage III-IV oocyte extract, and unlabeled competitor RNA [nonspecific (nsp., lanes 1, 3, 5, and 7) or Vg1 localization transcript (sp., lanes 2, 4, and 6)]. Shown is an autoradiogram of a polyacrylamide/10% SDS gel, with the positions of molecular weight markers shown at right. Indicated at left are the positions of the six proteins that form sequence-specific complexes with the localization transcript. (C) The results of in vitro binding assays are summarized: (+) normal binding of the indicated protein, (−) absence of protein binding (below 10% of normal), and reduced levels of protein binding indicated by the percent binding detected relative to wild type. The proteins are indicated at top, and the RNA transcripts are listed at left. Levels of protein binding were determined by densitometry of the autoradiograms, with any loading differences compensated for by normalization to the nonspecific protein of ≈22 kDa.
