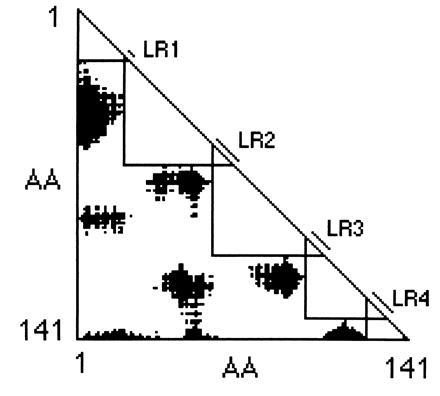
Figure 1.

Gō plot for hemoglobin. The black regions represent pairs of α-carbons that are separated by 28 Å or more in horse hemoglobin (2DHB). Five modules are identified by large triangles along the diagonal, whose size is limited by touching the black regions. The linker regions (LR) are defined as the region of overlap of those triangles.
