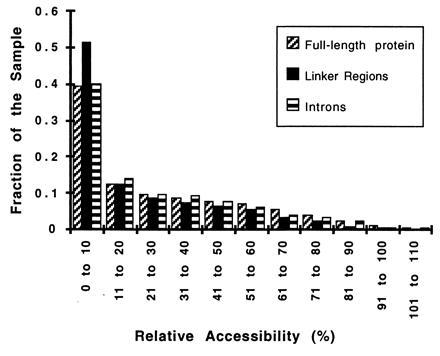
Figure 2.

Distribution of relative accessibility values for introns. A histogram of the relative accessibility as defined by naccess (ratio of solvent accessibility in the structure to that in the tripeptide Ala-X-Ala) for residues in general in the 32 proteins, residues in the linker regions, and residues that contain introns or that flank phase 0 introns.
