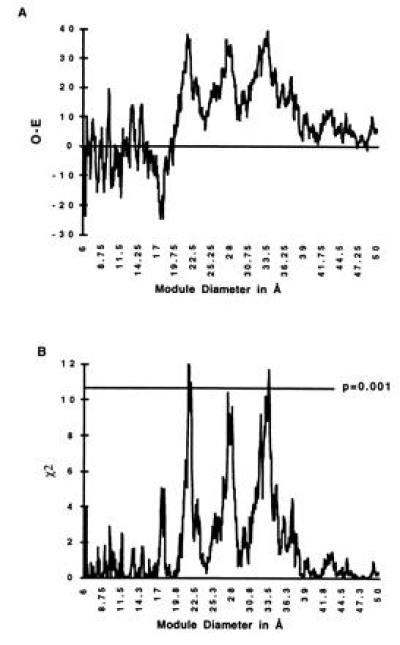
Figure 3.

Excess intron positions in linker regions as a function of module diameter. (A) The excess (Observed-Expected, O-E) values for each module diameter ranging from 6 to 50 Å in intervals of 0.05 Å. (B) The χ2 values for the excess. There are peaks of significance. The peaks centered at 21.7, 27.6, and 32.9 Å have P values around 0.001. The peak values are at 21.4, 27.4, and 33.5 Å, with χ2 = 12.0, 10.4, and 11.7, respectively.
