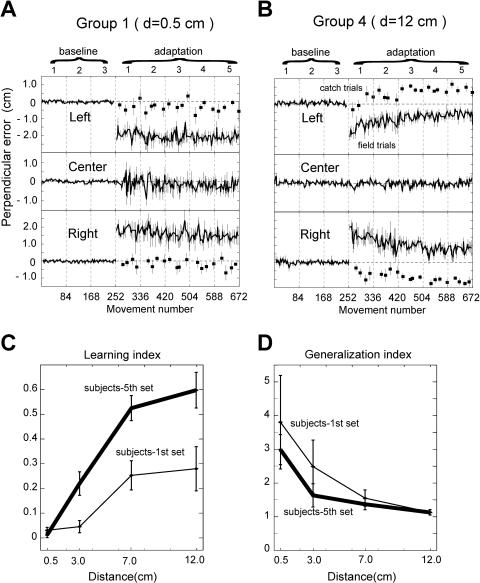
Figure 2. Movement Errors and Learning Performance as a Function of the Separation Distance.
(A) PE averaged across six subjects of Group 1 (d = 0.5 cm). Squares indicate catch trials. Error bars show SEM. The average SEM at the center is 1.3 mm in the baseline sets and 6.6 mm in the adaptation sets for Group 1. The average SEM is 2.1 mm in the baseline sets and 2.4 mm in the adaptation sets for Group 4.
(B) Errors were averaged across six subjects of Group 4 (d = 12 cm).
(C) Average learning index (Equation 1) across groups. Learning index is plotted against the separation distance between movements. Thin lines show the first adaptation set and thick lines show the last adaptation set. n = 6 for each distance. Error bars show SEM.
(D) Generalization index (Equation 2) against spatial distance between movements.

