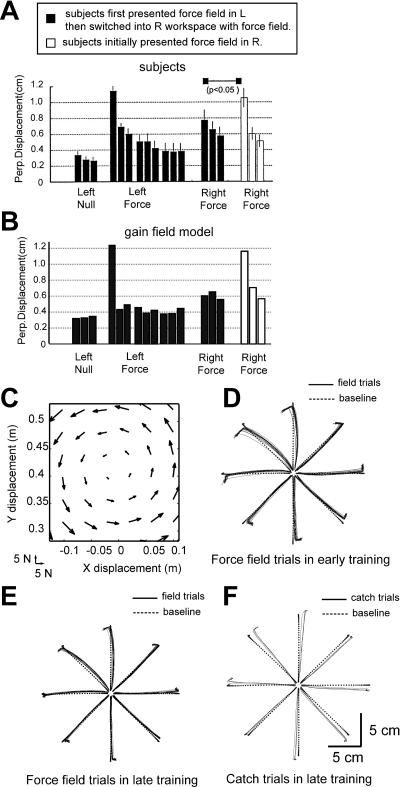
Figure 4. Gain-Field Representation Reproduces Previously Reported Patterns of Spatial Generalization.
(A) Figure 4A from Shadmehr and Moussavi (2000). The right workspace is separated from the left workspace by 80 cm. Each histogram bar is average maximum PE of 64 movements. Smaller errors of trained group than those of control group at right workspace indicate the transfer of learning from left to right workspace.
(B) Simulation results in the same format as (A); correlation coefficient to subject data is 0.89.
(C) A spring-like force field, F→ = K·x→ (K = [0 −55;55 0] N/m), was used for simulation.
(D) Hand path trajectories in field trials from the first set in the spring-like force field. Each set consists of 192 center-out movements. Targets are given at eight positions on 10 cm circumference in pseudorandom order.
(E) Hand path trajectories in field trials from the fifth set of training.
(F) Hand path trajectories of catch trials from the fifth set.

