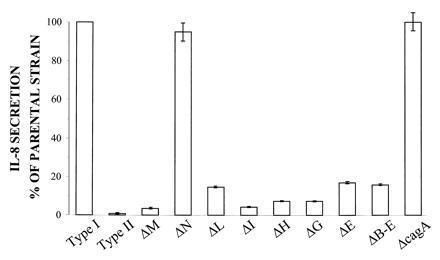
Figure 3.

Schematic diagram indicating the IL-8 secretion from KATO-III gastric epithelial cells induced by different mutants as compared with the parenteral strain G27. Mutants are single gene inactivation by mini-Tn3 insertion and are indicated by the name of the affected ORF. A type II strain is included as a negative control. The results represent the mean (SEM) of 7–11 experiments.
