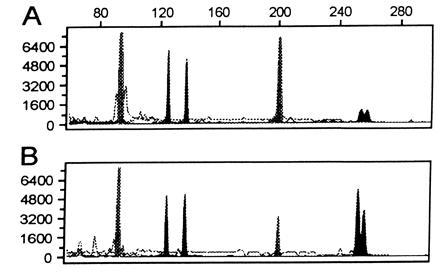
Figure 1.

Genotypic analysis of genomic DNA as compared with DOP-PCR-amplified genomic DNA. The individual is homozygous at two loci, D3S2418 (97 bp, 97 bp) and D6S1006 (200 bp, 200 bp) and heterozygous at two loci, D4S2366 (127 bp, 136 bp) and D1S2130 (252 bp, 256 bp). (A) An electropherogram of a multiplex PCR at these four microsatellite loci using 40 ng of genomic DNA as template. (B) An electropherogram of a multiplex PCR at the same four loci using 40 ng of DOP-PCR-amplified genomic DNA as template. Comparison of A and B shows matching genotypes and corresponding peak areas from the two templates. The y-axis represents arbitrary fluorescent units, and the x-axis represents the size of fragments in base pairs.
