
Figure 2.
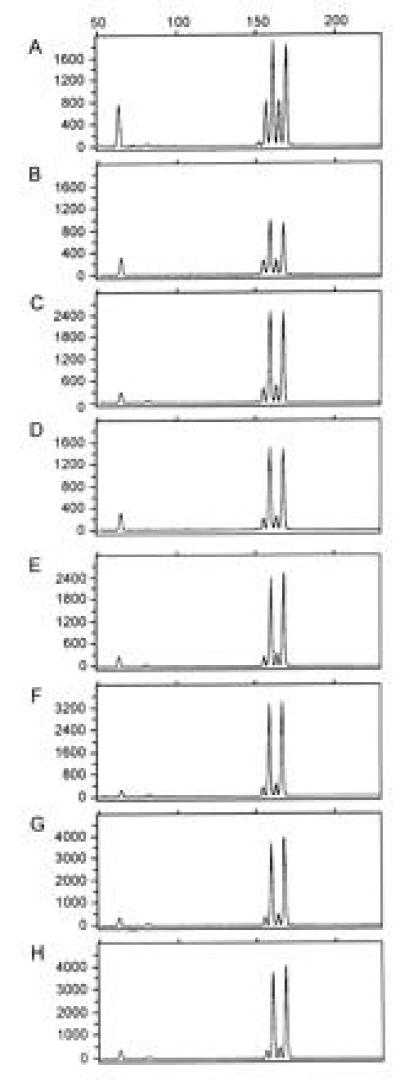
Comparison of yield from the DOP-PCR product generated from serially diluted genomic DNAs. All panels show electropherograms from genotyping of mixtures of DNA with fluorescently labeled D8S1132 primers as discussed. (A) An electropherogram from a mixture of total genomic DNA from two heterozygous individuals: 40 nanograms of genomic DNA from individual 1 (allele sizes 152 bp and 162 bp) were mixed with 80 ng of genomic DNA from individual 2 (allele sizes 158 bp and 168 bp). (B–H) Electropherograms at D8S1132 on 40 ng of DOP-PCR product derived from a DOP-PCR of a serial dilution of starting genomic DNA of individual 1 mixed with 80 ng of genomic DNA from individual 2, which allow measurement of relative yield. DOP-PCR product used in B–H are derived from starting genomic DNA amounts of 400 ng, 80 ng, 16 ng, 3.2 ng, 640 pg, 128 pg, and 26 pg, respectively. Comparison of the peak areas on the electropherograms reflects how the DOP-PCR products amplify relative to genomic DNA. These data were used to determine the corrected yield in Table 1. The y-axis represents arbitrary fluorescent units, and the x-axis represents fragment size in base pairs.