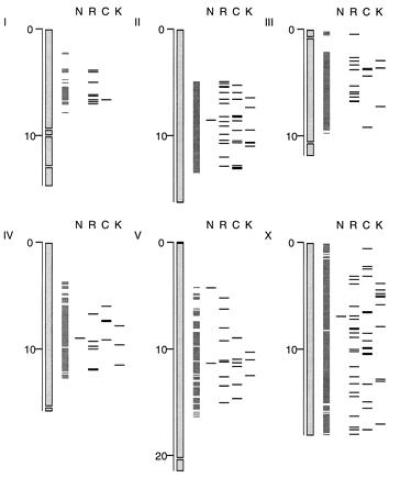
Figure 3.

Distribution of sequenced Tc1 insertion sites mapped to the genomic sequence. The physical maps of chromosomes I, II, III, IV, V, and X are represented by lightly shaded bars; the 40 Mbp of genomic sequence used in this study is indicated by darkly shaded bars. The scale is in approximate megabase pairs. Horizontal lines indicate the location of sequenced Tc1 insertion sites mapped in strains Bristol N2 (N), RW7000 (R), CB4000 (C) and KR1787 (K).
