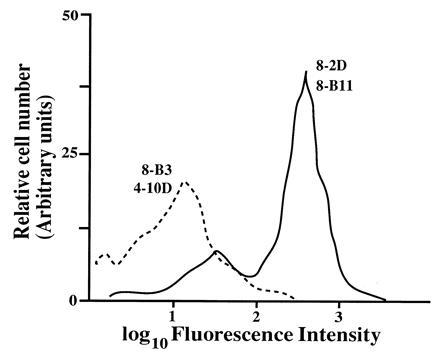
Figure 2.

FACS analysis of platelets with the anti-αvβ3 mAbs. Platelets were diluted in Tyrode buffer (5 mM Hepes/150 mM NaCl/2.5 mM KCl/5.5 mM glucose/0.1% BSA) and incubated with the indicated FITC-labeled antibodies for 30 min on ice. The cells were further diluted and analyzed with a FACScan without washing to avoid aggregation. The fluorescence intensity profile of cells stained with the 8-B3 and 8-2D mAbs is shown. The profile observed with the 8-B3 mAb was similar to that observed with 4-10D and with that of an anti-δTCR mAb used as a negative control (not shown). Similarly, the profiles obtained with the 8-2D and 8-B11 mAbs were almost indistinguishable.
