
Figure 2.

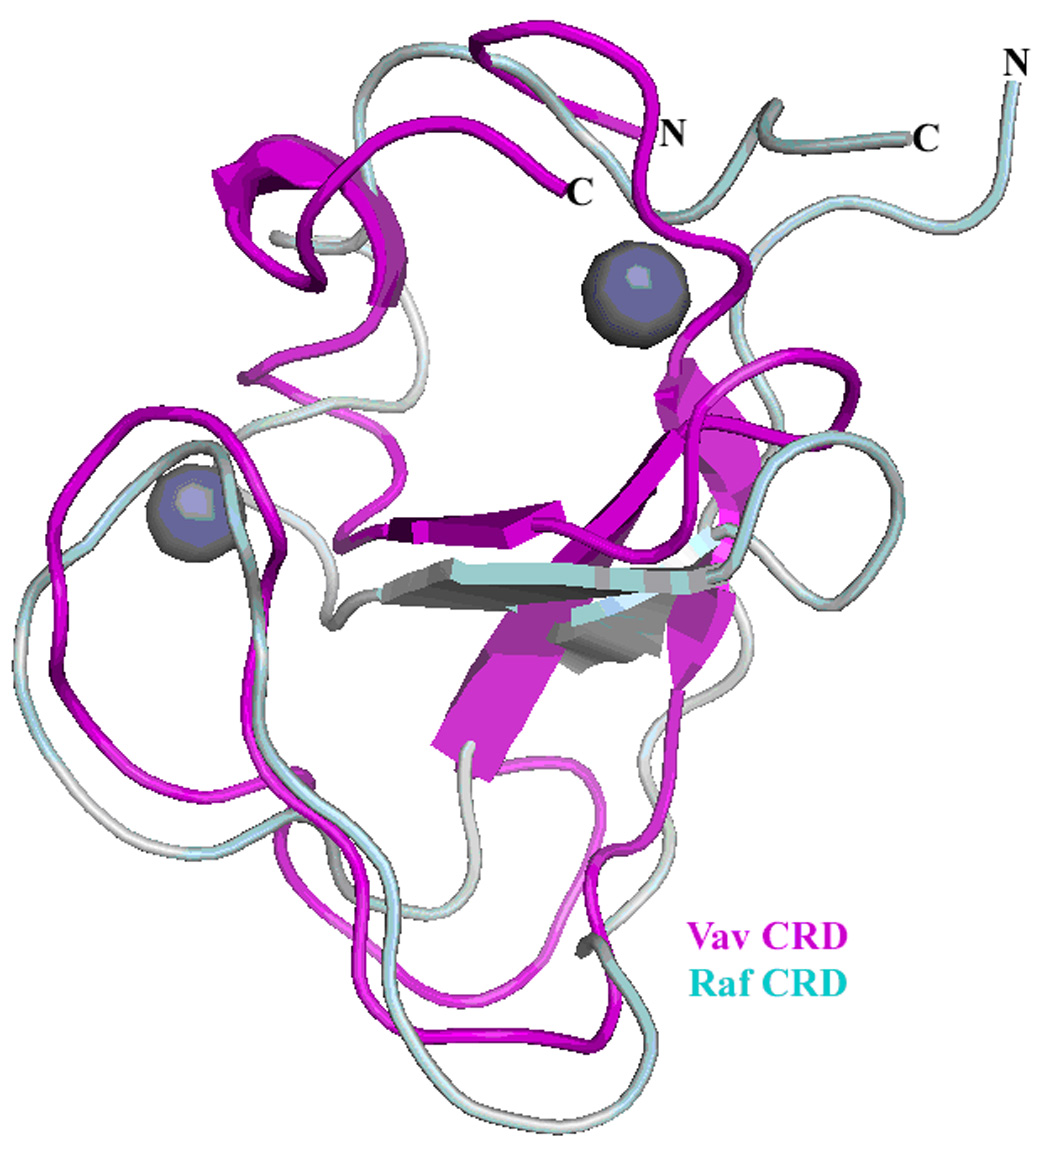
Figure 2A. Complete interlock network between the Vav1 DH domain, PH domain, and CRD. The DH domain is depicted in blue, the PH domain in cyan, and the CRD in magenta. Critical interactions between the domains are shown with dotted black lines.
Figure 2B. Superposition of the Vav1 cysteine rich domain; magenta) on the Raf1 cysteine rich domain (grey) previously described22. The overall structures are similar, with both similarly coordinating two zinc ions, depicted as spheres.