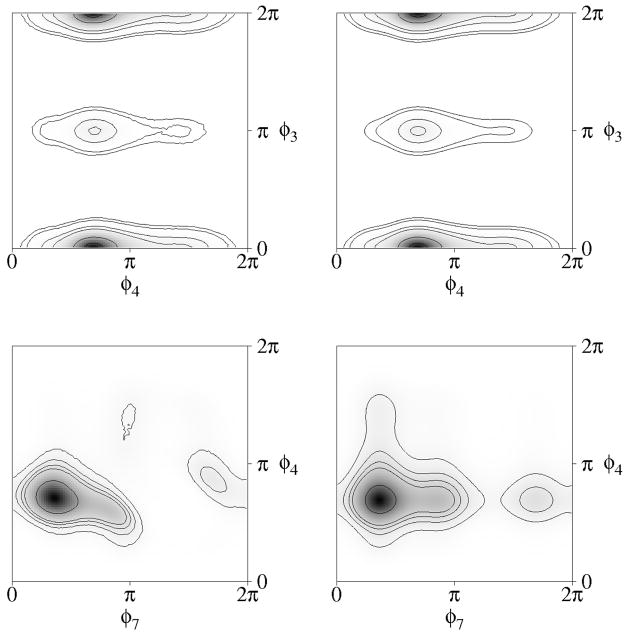
FIG. 3.
Sample two-dimensional distributions of the dihedral angles of R,S-tartaric acid. (a) Dihedral angles φ3 and φ4, which have a low estimated coefficient of association, rI = [1 − e−2I(3,4)]1/2 = 0.0657; (b) dihedral angles φ3 and φ4 plotted as just a product of their marginal distributions; (c) dihedral angles φ4 and φ7, which have a relatively high estimated coefficient of association, rI = 0.5491; (d) dihedral angles φ4 and φ7 plotted as just a product of their marginal distributions. Shading ranges from white (zero probability density) to black (maximum probability density).

