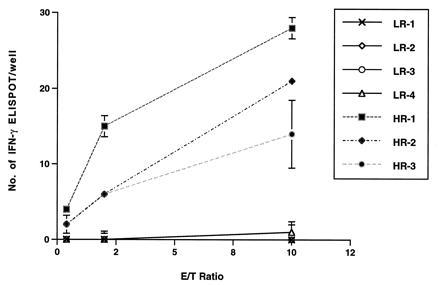
Figure 3.

ELISPOT analysis of HIV-1-specific IFN-γ production in PBLs of HR and LR uninfected individuals. ELISPOT assays were performed as described. The number of IFN-γ producing cells was determined using a computerized video-imaging system as described previously (Y.C. and L.-J.C., unpublished work). HIV-1-specific ELISPOT was shown as the mean ± SE in triplicate wells after subtracting the background from controls that were prepared using the same effector cells incubated with autologous HIV-1-negative PBLs and went through the same treatment as described.
