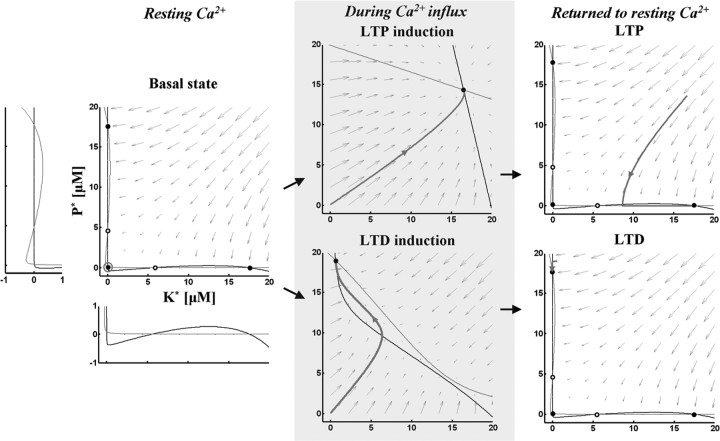
Figure 3.
The dynamics of the model in phase space. Left panel, Black and gray curves indicate nullclines for kinase and phosphatase respectively. The vector field is indicated by gray arrows. Nullclines at resting Ca2+ concentration (0.1 μm) create five steady-states. Open and filled circles denote unstable and stable steady-states, respectively. Gray open circle indicates the basal state. K* and P* denote the concentration of active kinase and phosphatase respectively. Insets, The areas where nullclines intersect are magnified. Middle panels, Nullclines during Ca2+ influx. Top, During LTP induction, the Ca2+ elevation (4 μm for 2 s) deforms nullclines to create one stable state. Bottom, During LTD induction, the moderate level of Ca2+ elevation (2.2 μm for 2 s) deforms nullclines to create one stable state. The basal state becomes unstable and moves to the closest stable state (gray trace). Right panels, Nullclines after Ca2+ removal. Nullclines form three stable states again in the resting Ca2+ concentration. The state moves to the closest stable state, LTP (gray trace, top) or LTD (gray trace, bottom).

