
FIG. 1.
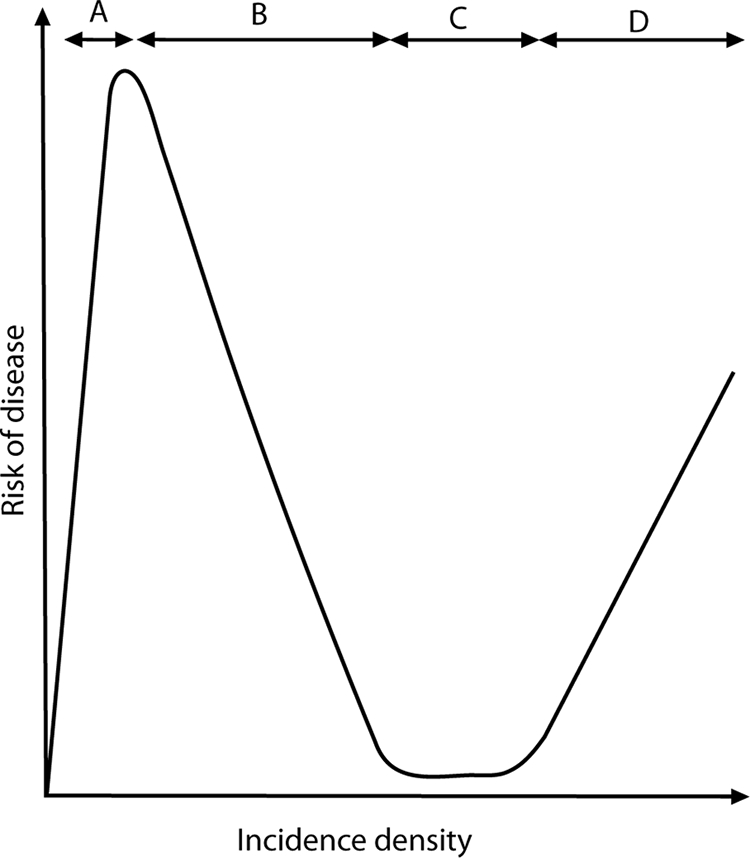
Hypothetical immunity-exposure curve, showing the hypothesized rise and fall of host susceptibility to severe disease with falciparum malaria. Segment A shows an increasing risk of death, principally from hyperparasitemia and cerebral malaria (and perhaps from respiratory and renal failure), rising with an increasing risk of exposure to infection. Segment B shows a declining risk of death with the onset of sufficient exposure to induce NAI. Segment C represents the threshold of exposure that maintains maximum NAI. Segment D shows an intensity of exposure that overwhelms NAI and where the risk of disease states such as severe anemia becomes predominant. (Reproduced from reference 13 with permission of the publisher.)