FIG. 5.
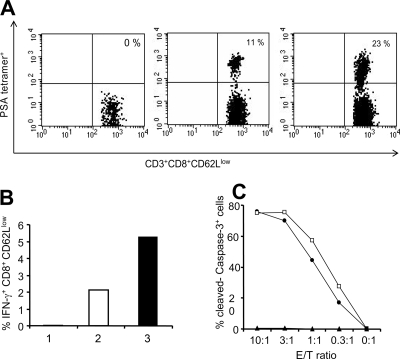
PSA-specific immune responses were examined by tetramer staining and intracellular cytokine staining for IFN-γ. Mice were immunized twice with 107 CFU of Lm-LLO-PSA and 108 CFU of the dal dat ΔactA 142 strain at 1-week intervals. For immune assays, spleens were harvested on day 6 after the boost. Spleens from three mice per group were pooled for this experiment. (A) PSA-specific T cells in the spleens of naïve, Lm-LLO-PSA-, and dal dat ΔactA 142 strain-immunized mice using PSA-specific tetramer staining. Cells were stained with mouse anti-CD8 (fluorescein isothiocyanate), anti-CD3 (Percp-Cy5.5), anti-CD62L (APC), and PSA tetramer-PE and analyzed by FACSCalibur. (B) Intracellular cytokine staining to detect the percentage of IFN-γ-secreting CD8+ CD62Llow cells in the naïve (bar 1), Lm-LLO-PSA- (bar 2), and dal dat ΔactA 142 strain (bar 3)-immunized mice after stimulation with 1 μM of PSA-specific H-2Db peptide for 5 h. (C) PSA-specific cytotoxic responses in mice immunized with the Lm-LLO-PSA vaccine (•) and the dal dat ΔactA 142 strain (□). Mice were immunized twice with 107 CFU of Lm-LLO-PSA and 108 CFU of the dal dat ΔactA 142 strain at a 1-week interval, and spleens were harvested on day 6 after the boost. The pooled splenocytes from each group were stimulated in vitro for 5 days after incubating with PSA-expressing stimulators. The target cells EL4 were pulsed with PSA H-2Db peptide, HCIRNKSVIL, and specific lysis was determined after incubating targets with different ratios of effector cells for 3 h. The experiment was repeated three times, and representative data are shown. Filled triangle, naïve mice; E/T ratio, effector/target ratio.

