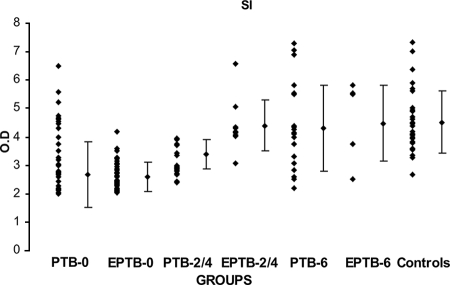
FIG. 1.
SIs of lymphoproliferative assay results for different clinical categories of patients with TB and healthy controls after in vitro stimulation with r32-kDa Ag of M. bovis BCG. Dots represent SIs. Diamonds with vertical bars represent mean ± SD of results for each group. Results are shown for the following groups (with the number of patients in the group in parentheses): PTB-0 (34) and EPTB-0 (33), PTB-2/4 (19) and EPTB-2/4 (10), PTB-6 (21) and EPTB-6 (6), and healthy controls (30). The P value was <0.000 for control group results versus PTB-0, EPTB-0, and PTB-2/4 group results.

