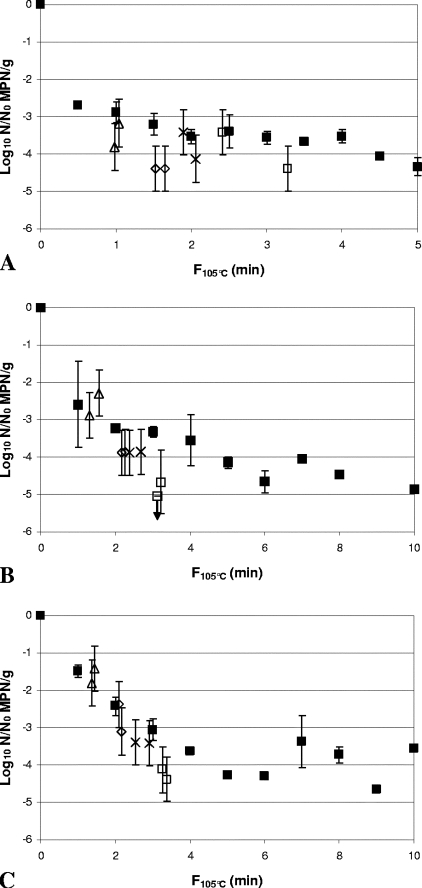
FIG. 6.
Comparison of inactivation of Clostridium botulinum FRRB 2807 in 30% (wt/wt) Bolognese sauce (A), 50% (wt/wt) cream sauce (B), and rice water agar (C) by heat-only and HPT processing. ▪, heat-only inactivation at 105°C (▪). (A) ▵, 600 MPa, 102°C, 60 s; ⋄, 600 MPa, 104°C, 60 s; ×, 600 MPa, 106°C, 30 s; □, 600 MPa, 106°C, 60 s. (B and C) ▵, 600 MPa, 102°C, 120 s; ⋄, 600 MPa, 104°C, 120 s; ×, 600 MPa, 106°C, 60 s; □, 600 MPa, 106°C, 120 s. Arrows indicate samples with spore count below the limit of detection (∼0.4 log10 MPN/g). Heat-only inactivation data are means of two replicates, and error bars are standard deviations. HPT inactivation data are for independent samples, and error bars are 95% confidence intervals for the MPN.

