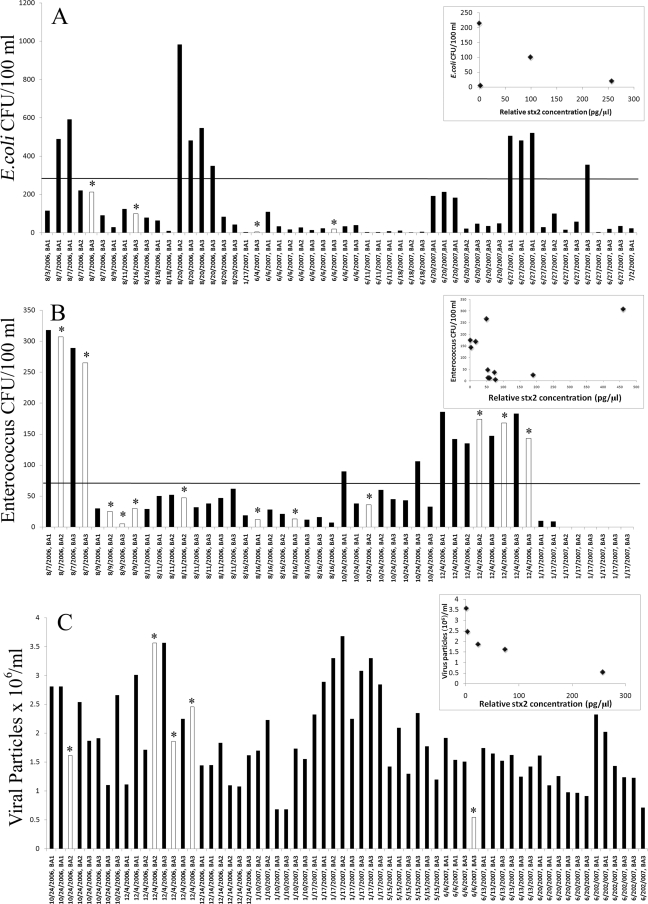
FIG. 3.
Comparison of samples that tested positive (white bars with *) or negative (dark bars) for the stx gene when the number of E. coli (A) or enterococcus (B) CFU or the number of viral particles (C) in the sample was known. The advisory limit for E. coli or enterococcus is indicted by a solid horizontal line. The normalized concentration of stx2, expressed in pg/μl, is compared to the number of E. coli (A) or enterococcus (B) CFU or the number of viral particles (C) in the inset of each panel. The data point for 9 August 2006 BA3 that tested positive for stx2 is not shown in the inset of the graph for comparison to number of enterococcus CFU, because the determined stx2 concentration of 7,200 pg/μl was too large to fit the scale of the graph.

