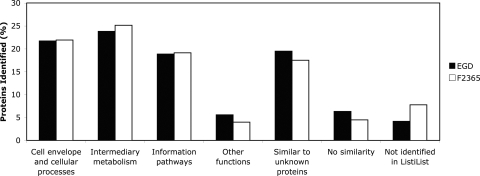
FIG. 1.
Percentages of proteins identified relative to the set of proteins with ListiList classification. Percentages (y axis) were calculated for both strains and classified according to the six categories provided by ListiList and a seventh category including those proteins that were not identified by ListiList.

