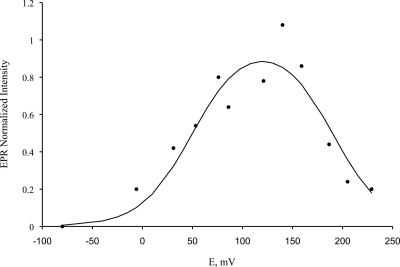
FIG. 8.
Redox titration of the diiron center monitored by EPR spectroscopy, following the changes in EPR intensity at the gmed value of the diiron center. The full line was also calculated for two one-electron reduction processes and corresponds to the formation and disappearance of the EPR resonance of the Fe(III)-Fe(II) mixed valence state, with reduction potentials of 190 and 50 mV.

