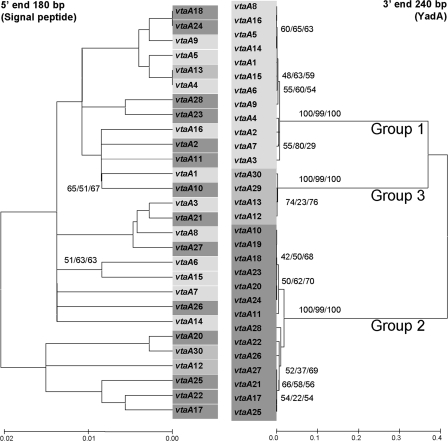
FIG. 2.
Phylogenetic analysis and comparison of the 5′ extended signal peptide (without the first 27 nucleotides corresponding to the primer used for gene amplification) and 3′ YadA ends (without the terminal nucleotides corresponding to the amplification primers) of all vtaA genes sequenced in this study. Bootstrap consensus trees were constructed by neighbor joining (Kimura 2 parameter distance) and maximum parsimony and minimum evolution (maximum composite likelihood distance) using 1,000 bootstraps. Only neighbor-joining trees are shown, although bootstrap values above 50 are indicated for the tree methodologies used. The sequences of vtaA19 and vtaA29 could not be used in phylogenetic reconstructions using the 5′ end due to a deletion in this area and a lack of amplification with the 5′-end primer for each gene, respectively. The grouping observed for the 5′ end is different from that of the 3′ end, indicating different rates of evolution in the extremities of each gene. Bootstrap values at the 3′ end support the subdivision in three groups of the translocator domain.

