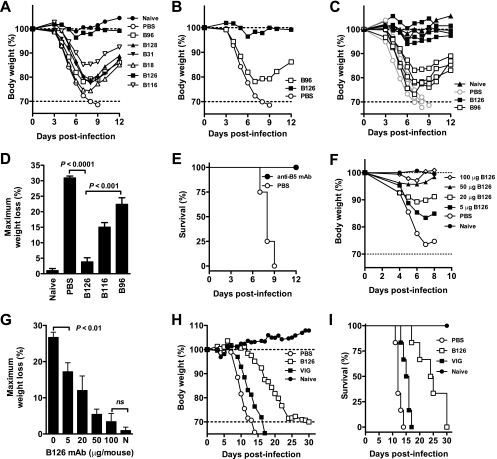
FIG. 5.
Protection against a lethal VACV infection. All anti-B5 MAbs exhibited some protective effect in vivo, and B126 IgG2a was highly protective. (A to E) Groups of BALB/c mice were inoculated i.p. with 100 μg of anti-B5 MAb (B18, B31, B96, B116, B126, or B128). Control mice received PBS. Naïve mice were unchallenged. One day later, mice were challenged intranasally with 5 × 10⁴ PFU of purified VACV. Body weight was tracked, and average weights were graphed (A). Dotted lines indicate starting body weight (upper) and terminal body weight (bottom). B126 and B96 group means are shown again for clarity (B), with all individual animal curves are shown (C), and weight loss nadirs were calculated for specific experimental groups (D). B126-treated mice exhibited no significant weight loss compared to uninfected mice (P ≫ 0.05) and were significantly better protected than mice treated with any other MAb (P < 0.001; n = 4/group). Panel E shows survival after intranasal challenge. All MAb-treated mice were protected from death compared to mock-treated mice (P < 0.01, for each individual MAb versus PBS). One of four independent experiments is shown. (F and G) Dose titrations of MAb B126 were tested against intranasal challenge with VACV as described above. Weight loss curves for each group (F) and percent maximum weight loss (G) were plotted. Five micrograms of anti-B5 MAb B126 completely prevented mortality, and mice exhibited significantly ameliorated weight loss versus no MAb (P < 0.01; n = 6/group). A 100-μg dose provided excellent protection, with virtually no weight loss observed (P = 0.5; ns). One of five independent experiments is shown. (H and I) SCID mice were inoculated with 100 μg of anti-B5 MAb B126 or 1.25 mg of VIG. Body weight was tracked after intravenous infection with 1 × 10³ PFU VACV. Mean percentage weight loss (H) and survival curves (I) were plotted for each experimental group. Anti-B5 MAb B126 protected substantially better than VIG, as determined by weight loss (P < 0.0005 versus no treatment; P < 0.0014 versus VIG; n = 6/group) and survival (P < 0.001 versus no treatment; P < 0.01 versus VIG). Bar graph error bars indicate SEM for each condition.

