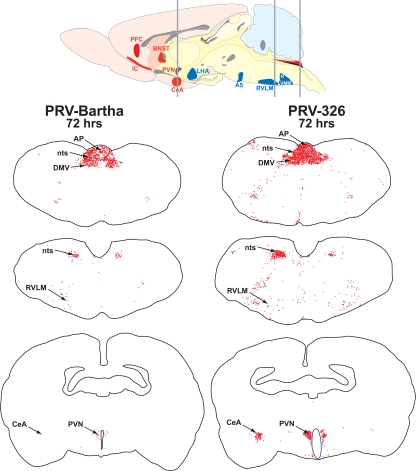
FIG. 8.
Distribution of infected neurons at three comparable levels of the neuraxis 72 h following injection of PRV Bartha or PRV 326 into the ventral wall of the stomach. The gray bars on the sagittal section at the top of the figure illustrate the positions of the coronal sections shown immediately below. The coronal sections sample the caudal brain stem at the level of the dorsal motor vagal complex (DMV) (nucleus of the solitary tract [nts] and area postrema [AP]), through the cardiovascular regulatory cell group linked to the sympathetic outflow (rostroventrolateral medulla [RVLM]), and through a level of the forebrain through the paraventricular nucleus (PVN) and central nucleus of the amygdala (CeA). Infected neurons were mapped by systematic examination of the section with a 40× objective. The position of each cell was recorded using an image analysis system. Each red dot represents an infected neuron. The maps demonstrate the dramatic increase in transport of PRV 326 relative to PRV Bartha in preautonomic circuits synaptically linked to the sympathetic and parasympathetic outflow.

