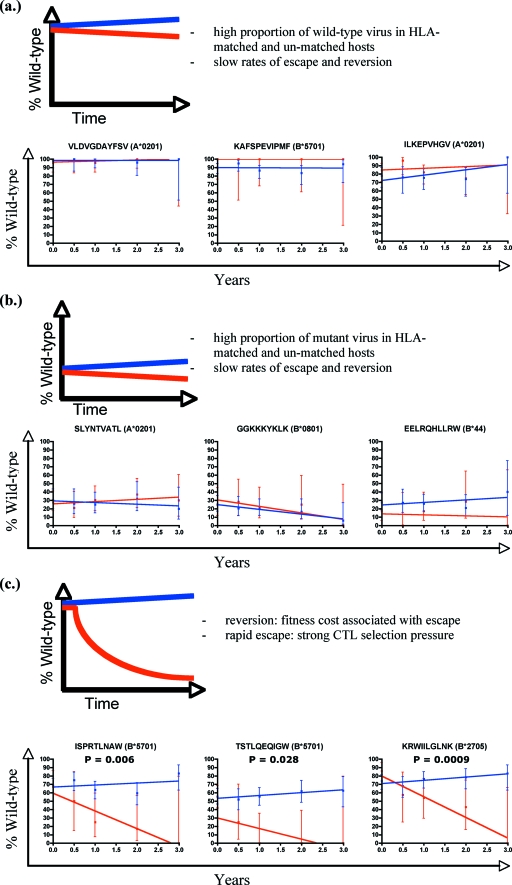
FIG. 2.
Prevalence of variation within defined optimal epitopes in HLA-matched and HLA-unmatched patients. For the epitopes shown, the percentage of those with wild-type sequences is shown for each time point. Each epitope is analyzed according to whether patients carried the restricting HLA class I allele (blue for HLA-unmatched and red for HLA-matched epitopes). Best-fit lines are drawn through the points using linear regression. Error bars show the 95% confidence intervals for each time point. Epitopes are divided into three groups and shown with an illustrative model: those that are conserved at baseline and over time regardless of HLA matching (a), those that are variant at baseline and over time (b), and those that are conserved at baseline but become more variable over time in the HLA-matched patients only (c). P values represent whether there is a statistically significant difference in the slopes of the two datasets.

