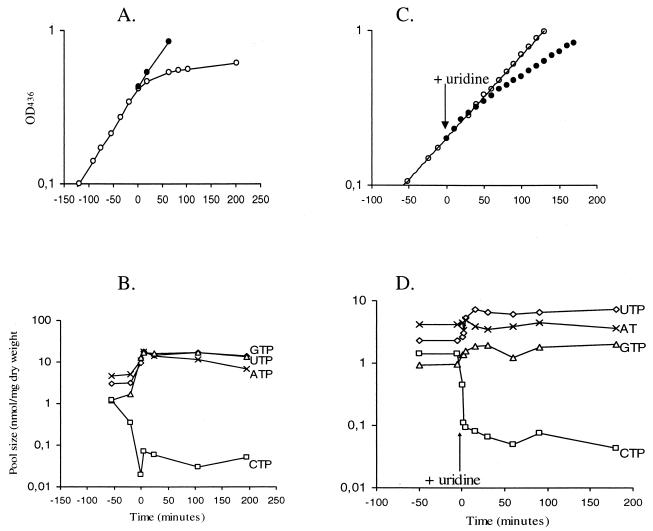
FIG. 4.
Growth curves (A and C) and nucleotide pool size changes (B and D) during starvation or limitation for cytidine. A cdd pyrG::lacLM mutant was grown in GSA defined medium. (A and B) Cytidine starvation. Cells were grown either with 20 μg of cytidine per ml (•) or with a limited amount of cytidine (○). Time zero indicates the point of reduced growth rate at an OD436 of 0.4. (C and D) Cytidine limitation. Cells were grown with cytidine (○) or with cytidine plus uridine (•). Uridine (500 μg/ml) was added at time zero at an OD436 of 0.2.

