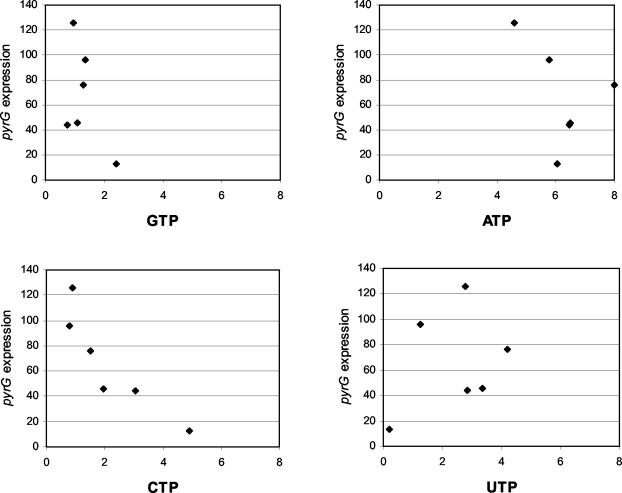
FIG. 6.
Correlation between the different nucleoside triphosphate concentrations and expression of pyrG in L. lactis. Plots of β-galactosidase activity as a measure for pyrG expression and nucleoside triphosphate concentrations for CJ238 and CJ300 under different growth conditions (Table 3) are shown. The nucleoside triphosphate concentration is given in nanomoles per milligram (dry weight), and pyrG expression is presented as units/OD unit.

