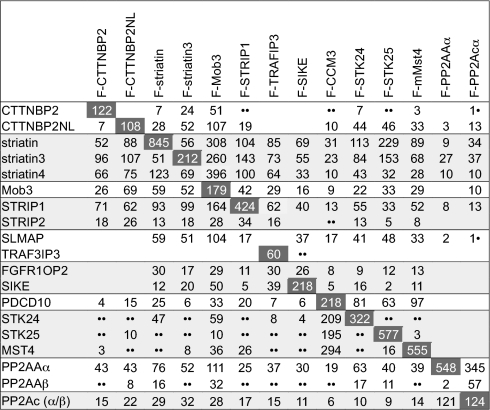
Table II.
Matrix distribution of spectral counts across FLAG pulldowns (columns) for one representative experiment
Hits are listed in rows; horizontal lines separate groups of paralogs. Dark gray shading indicates spectral counts for the bait. A complete table is presented in the supplemental materials. When multiple entry numbers matched the same gene, only the top entry is reported.
• For identifications based on a single unique peptide, a list of the experimental evidence is presented in supplemental Tables S6 and S7; annotated spectra are shown in supplemental Fig. S7.
•• ProteinProphet detected spectra corresponding to this protein, but no spectrum could uniquely be assigned to this entry.

