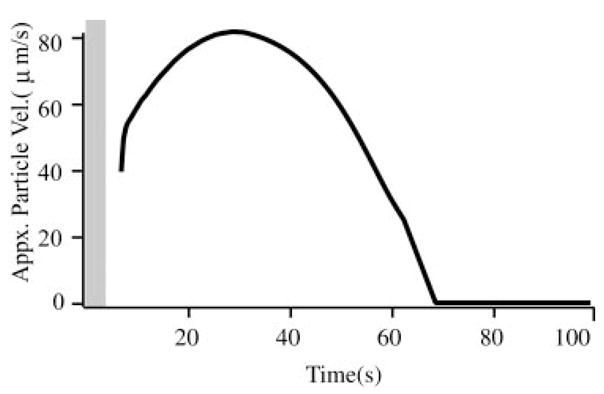
FIG. 4.

Bead velocity: typical particle velocities (μm/s) over the duration of the gravity-driven bead movement determined from a time sequence of digital images. Beads moved along the canal bottom wall with a velocity of about 80/μm/s in this animal (population average 81 ± 25/μm/s, n = 5 animals). Shaded vertical bar indicates the average duration of transient responses associated with the introduction of beads (cf. Fig. 3).
