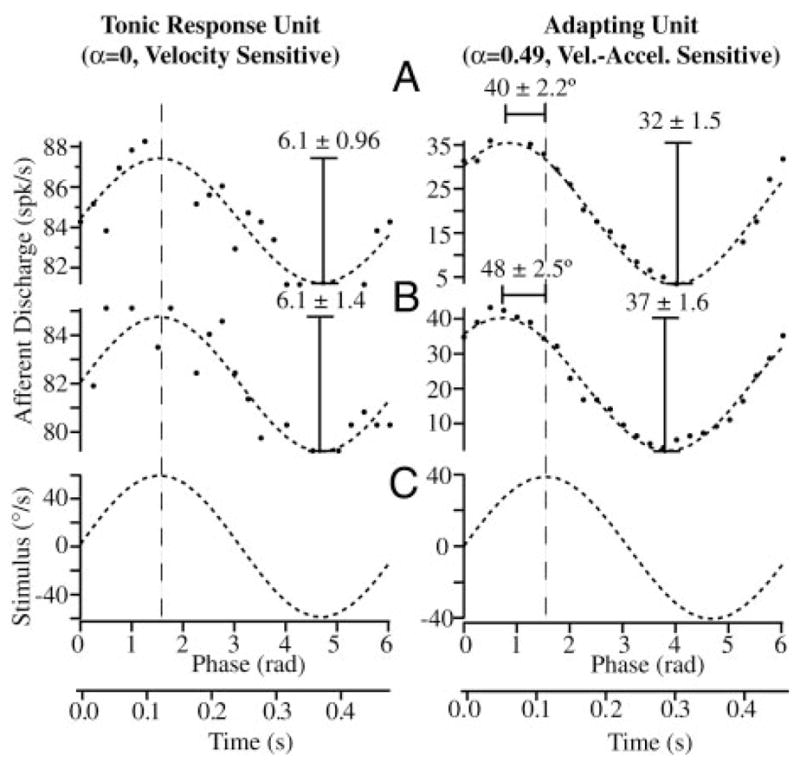
FIG. 8.

Calibration using sinusoidal stimuli: example afferent discharge rates of tonic (left, velocity sensitive) and adapting (right, velocity-acceleration sensitive) afferent units in response to 2-Hz sinusoidal stimuli (C) are shown in the control condition before introduction of beads (A) and after the beads came to rest (B). Gain (spikes/s per deg/sec) and phase of the peak response relative to the peak stimulus did not change significantly after introduction of the beads (A vs. B). Unit on the left is a typical velocity-coding afferent that modulated its firing rate in phase with the mechanical stimulus and had a gain that was constant with stimulus frequency (fractional order of α ≃ 0 at 2 Hz). Unit on the right had a phase advance of roughly 44° relative to the stimulus and a gain that increased with stimulus frequency, typical of a unit coding a mixture of angular velocity and acceleration (fractional order of α ≃ 0.49 at 2 Hz). Responses to sinusoidal stimuli were used to calibrate each afferent, thereby allowing us to convert discharge patterns observed during canalithiasis to the equivalent angular head velocity that would generate the same afferent responses (see Fig. 9).
