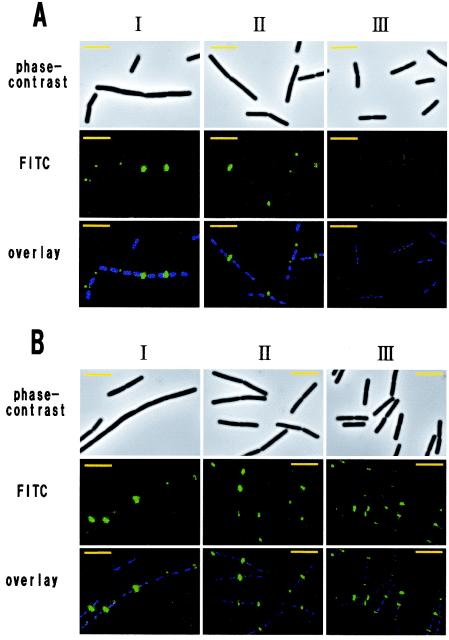
FIG. 6.
Localization pattern of LytE-3xFLAG on the vegetative cell surface. Time course IFM was performed with F3FL (lytE-3xFLAG) (A) and WE1F3FL (wprA epr lytE-3xFLAG) (B). These strains were grown in LB medium at 30°C. The OD600 values at the sampling times for panels I, II, and III, were 0.4 (early exponential phase), 1.0 (mid-exponential phase), and 2.3 (transition phase), respectively (A), and 0.4, 1.0, and 2.3, respectively (B). Each overlay is a DAPI-stained fluorescence image (blue) superimposed on an FITC-stained image (green). The exposure times were 0.1 s for phase-contrast microscopy, 0.001 s for DAPI, and 0.05 s for FITC. Bars = 5 μm.

