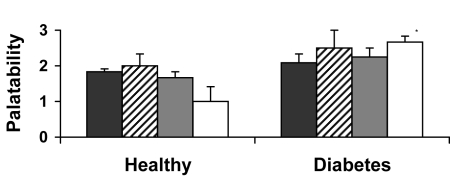
Figure 1.
Palatability of the viscous fiber blend biscuits and control meals using a bi-polar 7-point ordinal scale ranging from -3 to +3 (21). Data are expressed as mean ± standard error of the mean. *P < 0.05 (t test, compared with healthy participants). Closed bars – control white bread biscuits; striped bars – control white bread and margarine biscuits, gray bars – control biscuits; open bars – fiber blend biscuits.

