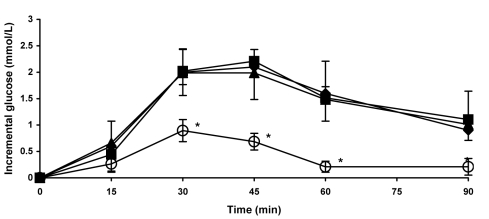
Figure 3.
Postprandial blood glucose response to the viscous fiber blend (VFB) biscuits and control meals in healthy participants. Data are expressed as mean ± standard error of the mean. Rhombs – control white bread; squares – control white bread plus margarine; triangles – control biscuits: circles – VFB biscuits. *P < 0.05 (compared with control white bread). P value calculated using paired t test.

