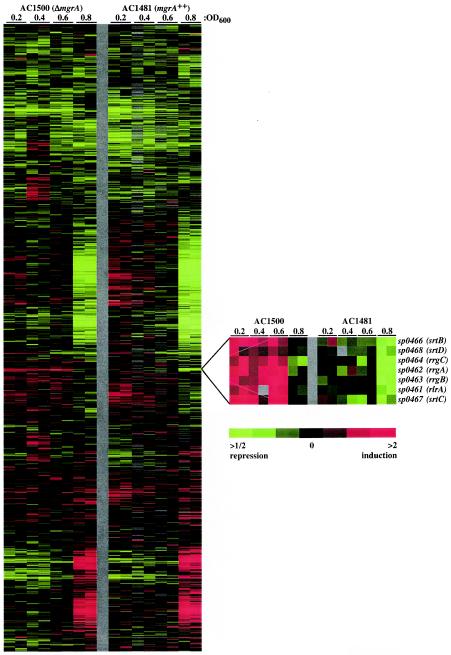
FIG.3.
Gene expression profiling of non-MgrA-expressing strain AC1500 and MgrA-overexpressing strain AC1481 by spotted DNA microarray analysis. The data are measures of relative gene expression at the culture optical densities indicated and represent the quotient of hybridization of the fluorescent cDNA probe prepared from the AC1500 or AC1481 sample and hybridization of a reference pool. Red and green represent high and low experimental sample/reference ratios, respectively (see scale bar). Gray indicates technically inadequate or missing data. The columns represent arrays, and the rows represent genes. See Materials and Methods for experimental details. Data for all of the arrays used in this study are available elsewhere (6).

