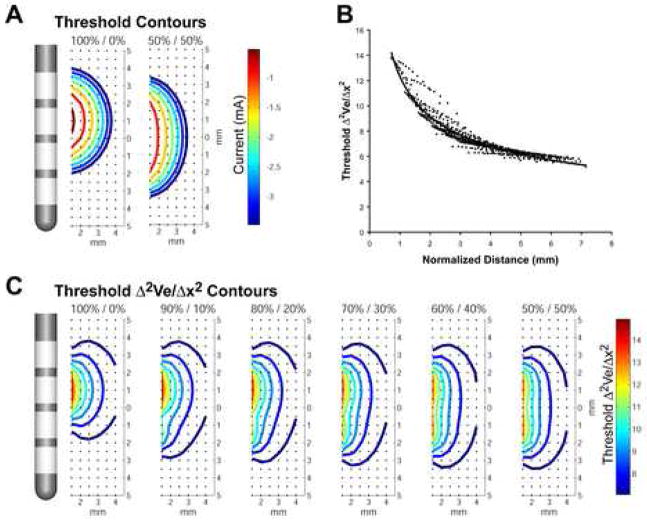
Figure 2.
Axonal activation prediction. A) Axons were distributed in a grid around the DBS electrode (black dots). The voltage within the tissue medium was determined relative to the active DBS contact(s) and the threshold for action potential generation in each axon was defined. B, C) The second spatial difference of the extracellular voltage at threshold was calculated for each axon as a function of distance from the electrode for a range of current amplitudes and percentage mixtures between adjacent contacts. A predictor curve was generated by aggregating the data and fitting it to an exponential function.

