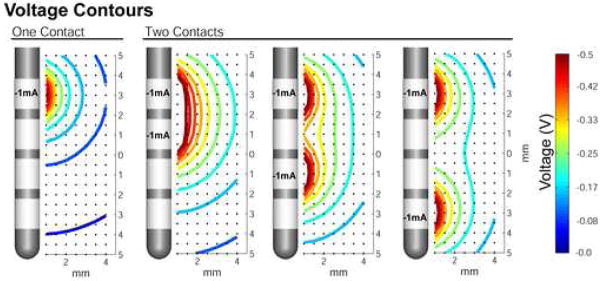
Figure 6.
Effects of electrode contact spacing on voltage distribution. The effects of contact spacing are shown by comparing current injection through one contact (leftmost panel) to injection through two contacts. The current injected is indicated on each electrode contact, and the resulting distribution is represented by isovoltage contours according to the colorbar at right. The voltage distributions from adjacent active contacts show substantial overlap (2nd panel from left), while the presence of one or more intervening dormant contacts results in separate distributions that approach the single contact configuration (rightmost two panels).

