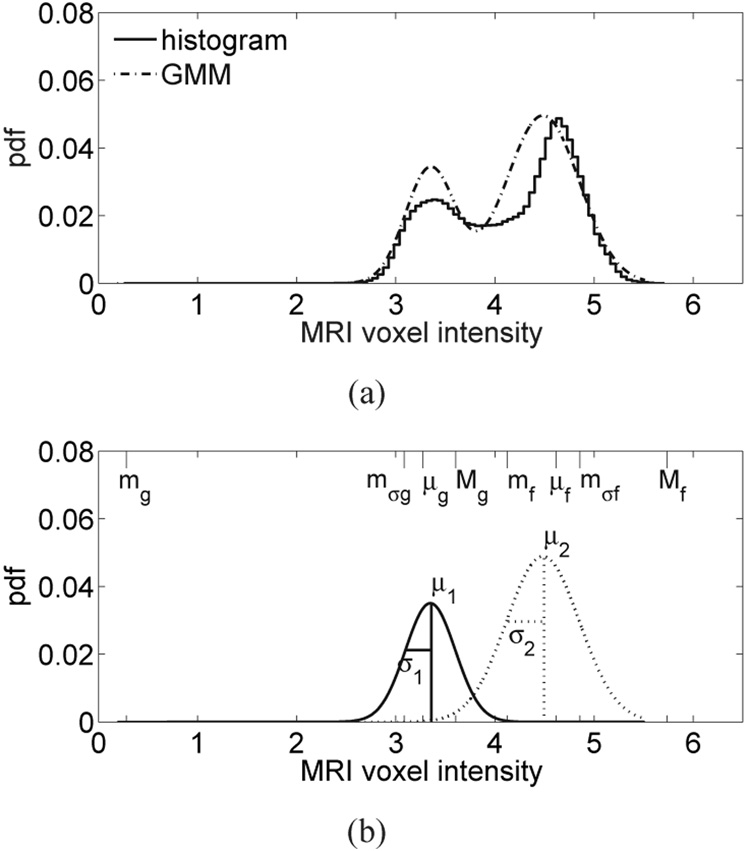
Fig. 5.
(a) Histogram of MRI voxel intensities for a patient with extremely dense breast tissue, and the composite two-component GMM of the histogram. (b) The two individual components of the GMM corresponding to fatty tissue (dashed) and glandular/fibroconnective tissue (solid). Each component is labeled with its GMM parameters. The eight piecewise-linear mapping parameters are indicated along the MRI voxel intensity axis (top edge).

