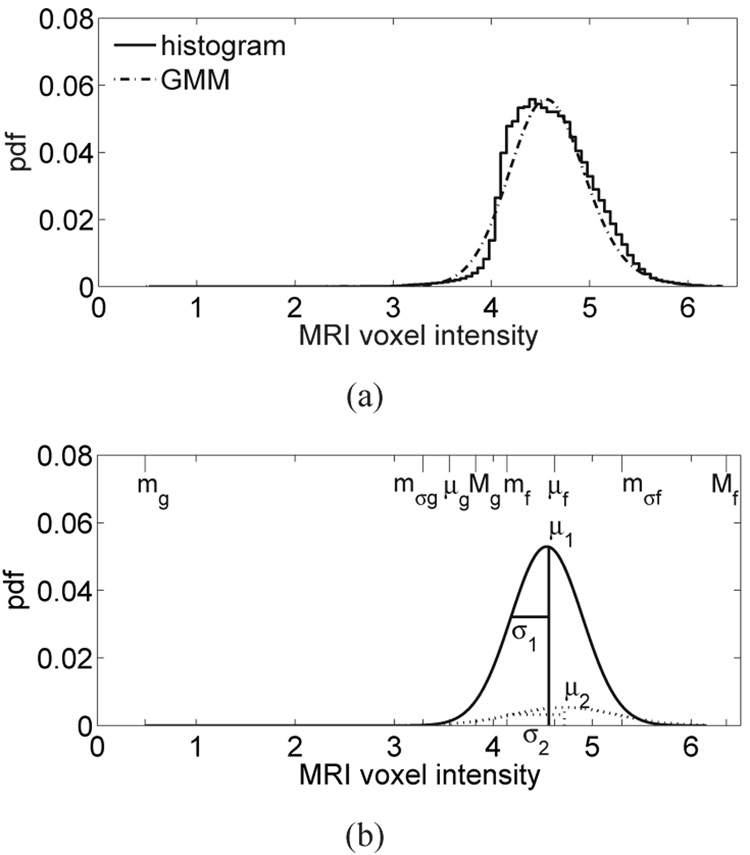
Fig. 6.
(a) Histogram of MRI voxel intensities for a patient with almost entirely fat breast tissue, and the composite two-component GMM of the histogram. (b) The two individual components of the GMM are shown with dashed and solid lines. Each component is labeled with its GMM parameters. The eight piecewise-linear mapping parameters are indicated along the MRI voxel intensity axis (top edge).

