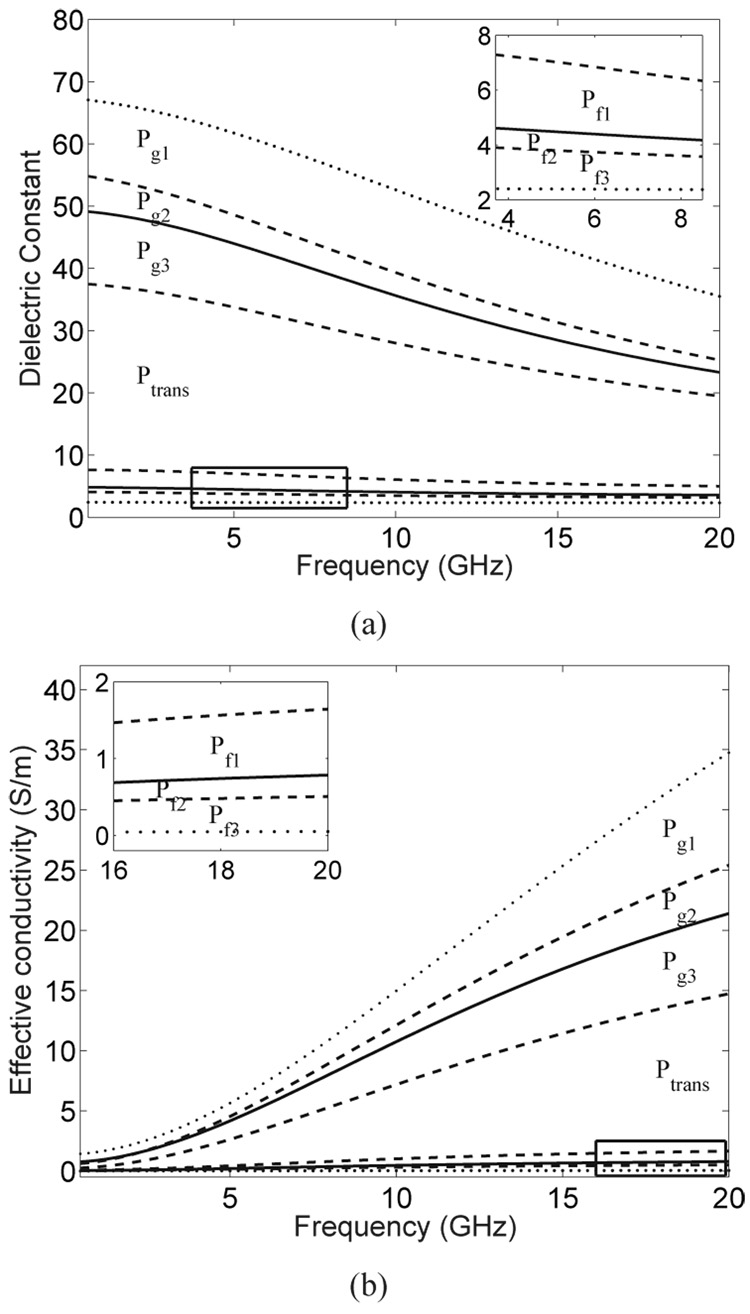
Fig. 7.
(a) Wideband dielectric constant and (b) effective conductivity curves that define the bounds on seven ranges of dielectric properties. The range labels (Pg1, Pg2, Pg3, Ptrans, Pf1, Pf2, and Pf3) correspond to seven tissue categories. The two dotted curves represent the maximum and minimum tissue properties. The two solid curves represent the median properties of predominantly glandular/fibroconnective tissue and predominantly fatty tissue. The two pairs of dashed curves represent the 25th and 75th percentile properties for predominantly glandular/fibroconnective tissue and predominantly fatty tissue. The Cole-Cole parameters for these eight curves are given in Table I.

