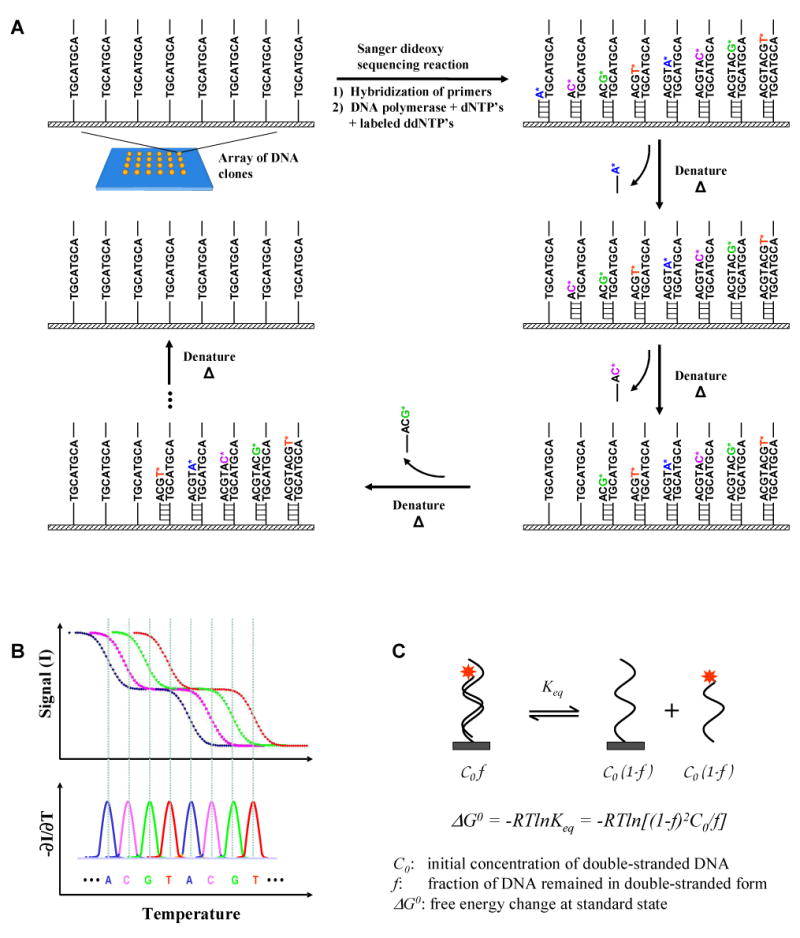
Figure 1. SBD principle.

(A) The basic concept. Standard Sanger dideoxy sequencing reaction is performed on the templates immobilized on a surface. The dideoxyribonucleotides are incorporated randomly at each strand. The labeled dideoxy terminated fragments are then sequentially removed from the templates on the surface by gradually increasing the temperature or other degrees of denaturation. (B) If the denaturation process is monitored by measuring only the fluorescence from the molecules on the surface, sequence information can be obtained from the profile of signal intensity as a function of the degree of denaturation (in this example, temperature). The negative derivative of denaturation curve (-∂I/∂T) results in a graph similar to the conventional electropherogram in gel electrophoresis-based Sanger dideoxy sequencing. The sequence is decoded from the peaks in the graph. For clarity, the hypothetical denaturation curves of an 8-base sequence are shown. (C) The denaturation process is the reverse process of the hybridization reaction. At a given temperature, the equilibrium constant is determined by the change in free energy of the reaction (ΔG0), which is strictly determined by the thermodynamic properties of the double-stranded and single-stranded DNA molecules.
