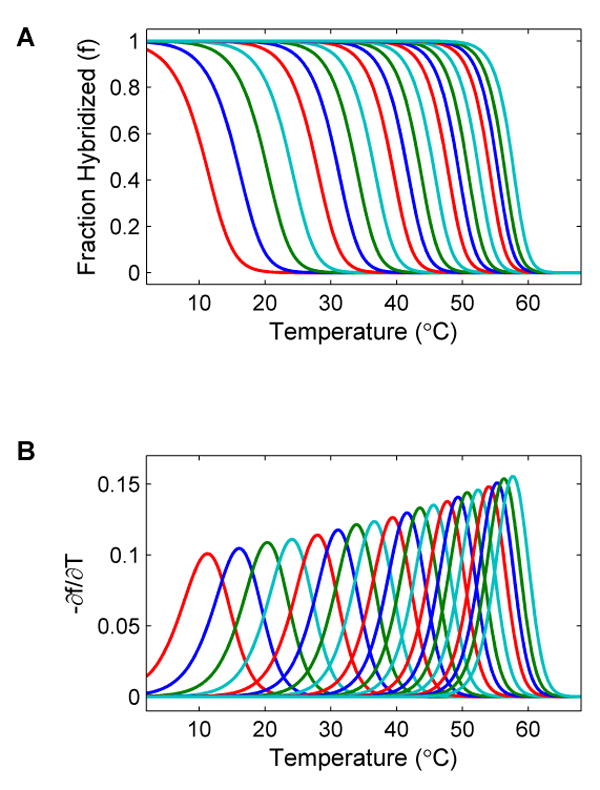
Figure 2. Simulated denaturation curves and their negative first derivatives.

(A) Denaturation curves and (B) the corresponding negatives of the first derivatives of the curves of a series of 20 oligonucleotides each of which consists of a common 12 base primer with the sequence “ATTAAACCTTAA” and additional bases from the first to the 20th bases of the sequence “GTCAGTCAGTCAGTCAGTCA”. The leftmost curve is the simulated profile of the sequence with 13 bases. The rightmost curve is the profile of the full length sequence with 32 bases. A total of 20 curves are shown. As can be seen, the melting temperature increases monotonously as additional bases are added to the sequence.
