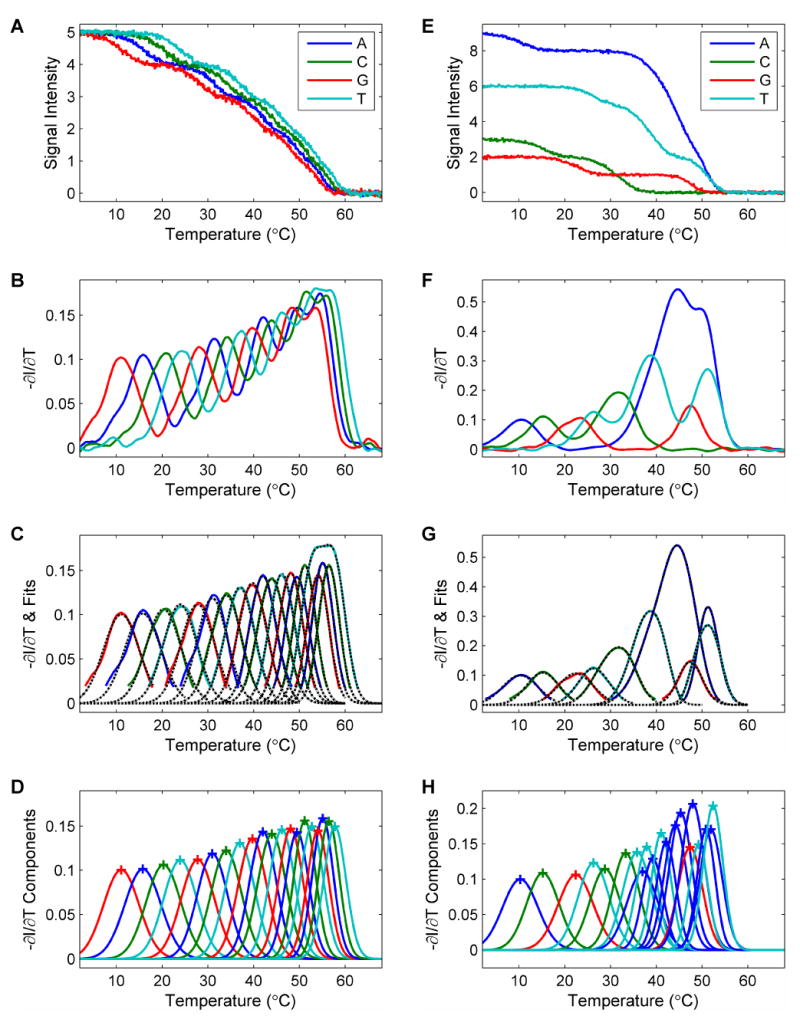
Figure 4. Base calling algorithm.

This figure illustrates the base-calling process with two examples. (A-D) A simple case is shown with the sequence “GTCAGTCAGTCAGTCAGTCA”, where the 4 different base types are distributed evenly along the sequence. All the bases are called correctly. (E-H) Another case is shown with the sequence “ACGTCCTATTAAAAGATAAT”. There are extensive overlaps between some of the curves. The called sequence is “ACGTCCTATATAAAGATAAT”. There is a pair of substitution errors in the call. (A) & (E) The simulated fluorescent signal is the sum of all the contributing melting curves in the corresponding channel. A 5% random Gaussian noise is added. (B)&(F) The smoothed negative derivatives of the curves. Some peaks are the combination of multiple melting curves. (C)&(G) Each peak is fit to a sum of Gaussian curves to deconvolve the components. These figures show the results from the correction fit where interference from neighboring curves have been subtracted. The black dashed lines show that each fitted curve overlaps with its colored solid original curve well. (D)&(H) The components from the fit. The peaks are labeled with a cross (+) for visualization. By reading from lower to higher melting temperature, the base sequence can be determined. Blue: A. Green: C. Red: G. Cyan: T. See text for more detailed description of the steps involved in the algorithm.
