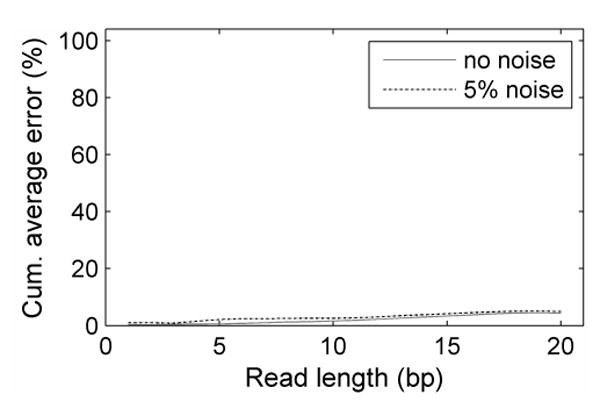
Figure 5. Error rate of SBD.

The cumulative average error rate is plotted versus read length under two different noise levels with 0.1°C sampling frequency. The error rate increases linearly with read length. With a read length of 20 the error rate is 4%. The increase in error rate resulted from 5% added simulation noise is not significant, indicating that SBD is robust against small measurement errors. Solid gray line: 0% noise. Dotted black line: 5% noise.
