
Figure 6. Experimental measurements.
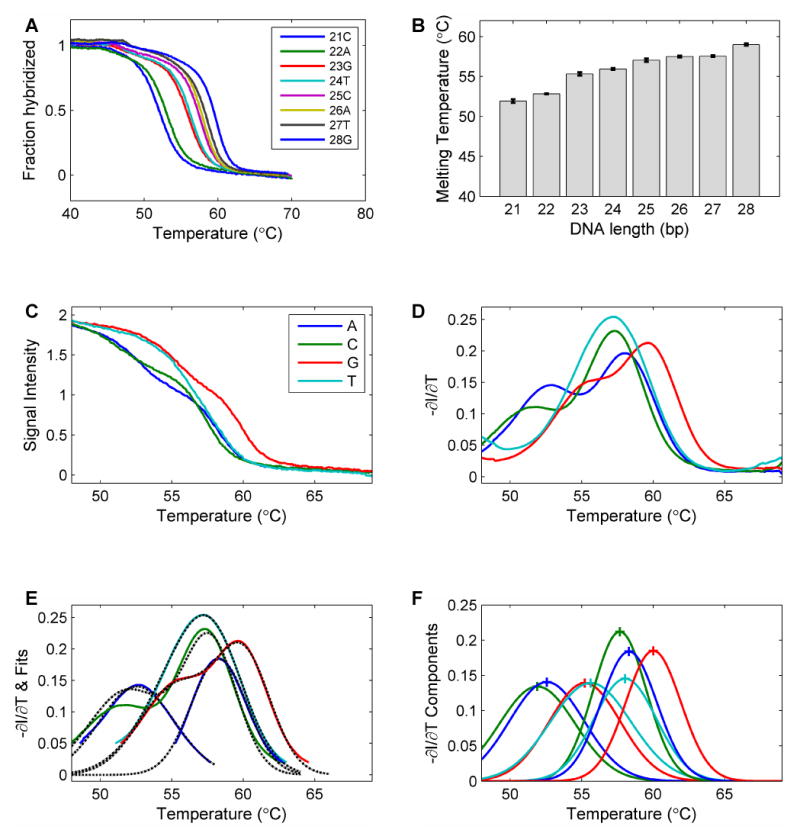
(A) The melting profiles of the 8 individual oligonucleotides with 21 to 28 bases from the sequence “CCATCAGTCATGTACGAAGTCAGTCATG”. (B) The melting temperatures of the oligonucleotides. It is obvious that the melting temperature increases as the length of the oligonucleotide increases. (C) Solution measurements mimicking the SBD process. To mimic the denaturation profile of Sanger fragments, the oligonucleotide probes that end in the same base type were combined to measure the SBD signals for an 8-base read: the 22mer and 26mer for A, the 21mer and 25mer for C, the 23mer and 28mer for G, and the 24mer and 27mer for T. (D) The negative derivative curves of the denaturation curves. These curves were used for the base-calling process. (E) The fitting of the profiles with a sum of Gaussian curves. (F) The resolved individual components used to determine the base sequence. Blue: A. Green: C. Red: G. Cyan: T.