
Figure 7. Analysis of ActRIIA and ActRIIB expression.
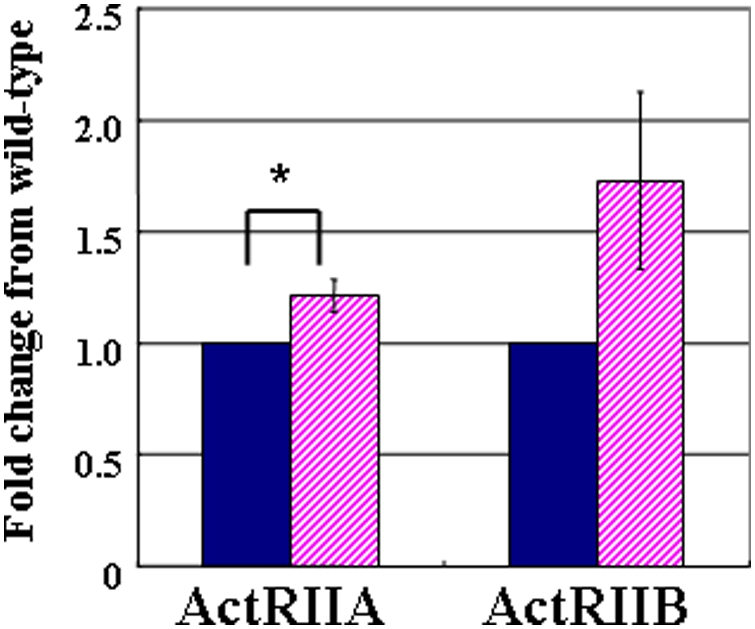
Data are expressed relative (n-fold) to the wild-type pancreas and correspond to the means and standard errors for three independent experiments performed in triplicate. *, P<0.05. wild-type n = 9, Dicer1-hypomorphic mice n = 9.