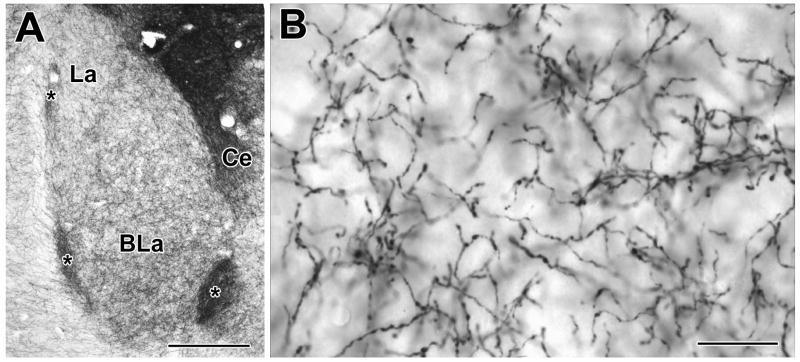
Fig. 1.
Digital photomicrographs of tyrosine hydroxylase (TH) immunoreactivity in the rat basolateral amygdala, using Ni-DAB as a chromogen. A) Low-power micrograph illustrating TH immunoreactivity in the anterior basolateral (BLa) and lateral (La) nuclei (Bregma −2.56 level of Paxinos and Watson, 1997; medial is to the right). Ce = central amygdalar nucleus; asterisks indicate intercalated nuclei. B) Higher power micrograph illustrating the morphology of TH+ axons in the BLa. Scale bars = 200 μm in A and 20 μm in B.

