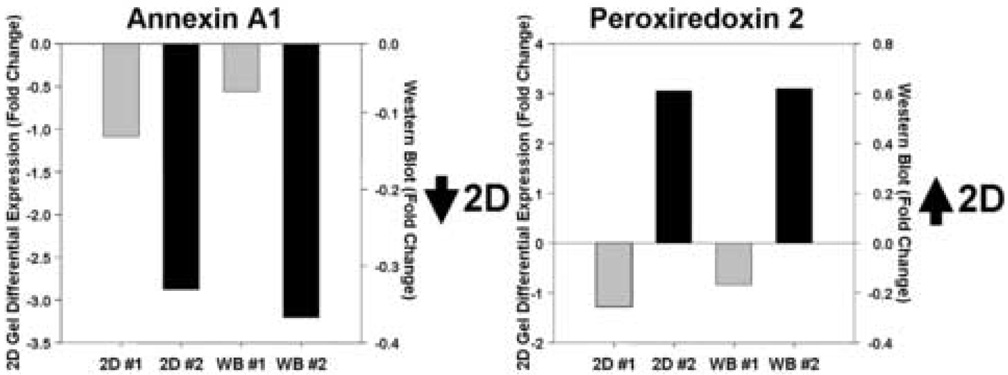
Figure 2. Correspondence of relative expression levels of two proteins between 2DE analysis and Western immunoblot analysis following VPA treatment.
Examination of annexin a1 (Spot #278) and peroxiredoxin 2 (Spot #460) expression in two study patients using 2DE differential spot analysis and immunoblot analysis demonstrate similar relative levels of expression between the two methodologies. Expression levels are indicated as fold-level changes between the 4-week treatment and baseline samples. 2D, 2D gel analysis; WB, Western blot analysis; #1, subject #1; #2, subject #2.

